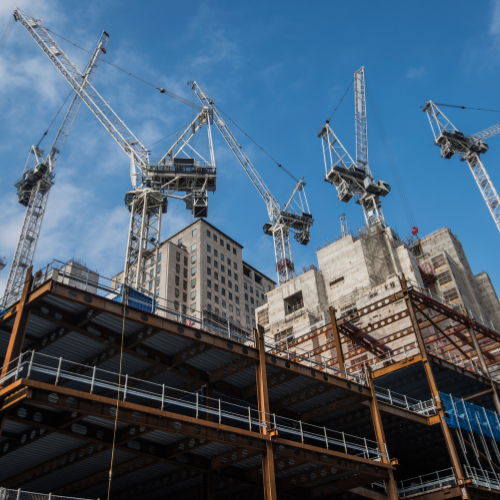
August’s total construction hiring added a historically strong 34,000 to the construction labor force. The month’s gains represented the second strongest reading in the last 12 months, beat only by March’s 37,000 gain. Unsurprisingly, Heavy Engineering (Civil) added 14,000 of these jobs. Residential construction added the second most with 5,000. These jobs are not evenly spread around the country. The chart below shows how construction employment has changed by state from June 2023 to June 2024. 35 states saw an increase, 1 remained unchanged and 14 states saw a decrease.
Construction has struggled in recent years to find enough people to fill the open jobs that exist. This has driven wages up for the industry and has made it an increasingly attractive sector to work in. For the last 10 years construction wages have grown faster than inflation.
Finally, construction costs remain volatile but contractor’s have started to recoup some of their losses driven by these increases. Sadly, some of that has been undone in recent months. The chart below shows the relationship between bid prices and the cost of the underlying input costs. The red chart areas signify times that construction costs rise faster than bid prices. The white areas represent bid prices remaining elevated with falling construction costs.
Contact Joshua to see how you could minimize risk.
814.657.2077 | [email protected] | LinkedIn
- |

Employee Spotlight: Alexis Leysock
Please join us in welcoming Alexis Leysock to the Seubert Team! Alexis joins Seubert’s Employee

50 Years of Minimizing Risk and Maximizing Potential
Seubert & Associates celebrates 50 years of helping businesses nationwide minimize risk and maximize potential

Employee Spotlight: Julia Bussard
Please join us in welcoming Julia Bussard to the Seubert Team! Julia joins Seubert’s Administrative


 Joshua Restauri